Introduction
SOURCERY - which was presented as a DEMO paper at the CIKM 2018 conference in Torino, Italy - is an interactive Source Selection web application. To read the whole paper see [1]. For a PDF version of this guide click here. To try out the demo visit www.edabel.co.uk/SOURCERY-DEMO.htm Any comments/questions/suggestions/bugs! get in touch with Ed Abel.
With increasingly many possible data sources data scientists are often only interested in a subset of available sources, where the data selected is the best fit for their purpose and needs. For example, given 2 users with different preferences regarding real estate data Completeness and Postcode information locality quality.
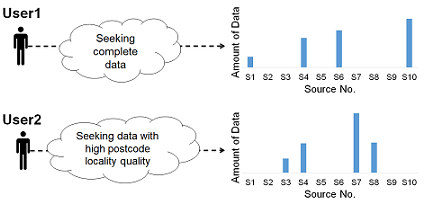
- Solution for User 1 of data from more complete sources
- Solution for User 2 of data from sources with high Postcode quality
Therefore, different solutions are more appropriate and fit for purpose in relation to a user’s context and needs for the data.
However, invariably in such source selection problems multiple criteria are significant to a user with differing degrees of importance. Capturing user preferences regarding the relative importance between a set of criteria is not straight forward. Within SOURCERY user preferences regarding a set of criteria are elicited via Pairwise Comparisons, in which the user considers a pair of criteria at a time and defines his/her preference, and verbal strength, between the pair. Then, from a set of pairwise comparisons, numerical criterion weights are then derived. Pairwise comparisons facilitate a separation of concerns that can help a user to define a more accurate representation of preferences [2] enabling a user to tackle data selection tasks in an effective and usable way [3]
Tutorial Case Study Example
1. Setup
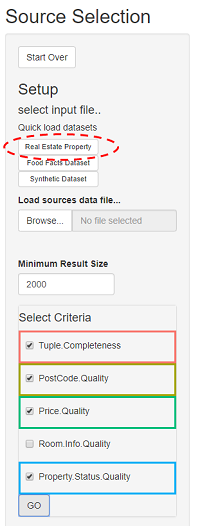
First a dataset is selected and SOURCERY loads the data pertaining to the set of available sources of the dataset. The minimum result size parameter is also set - defining the minimum overall size of the resulting set of selected sources.
- Select and load the "Real Estate Property" dataset - A real-world dataset, consisting of data from 137 web-scraped UK real-estate sites , extracted via the DIADEM system [4].
- Initially leave the minimum result size as 2000 - this denotes that set of sources will be selected such that their overall tuples selected will be at least 2000
Next, possible criteria related to the selected dataset can then be selected. From this set the user can select the subset of criteria that are important to them for his/her source selection needs. For the real estate property data sources there are a set of representative criteria containing both domain agnostic criteria, such as tuple completeness, and domain specific criteria, such as postcode quality. (For full explanations and calculation definitions for these criteria see [5]).
For example, select the criteria:
- Tuple Completeness
- Postcode quality
- Price Quality
- Property Status Quality
Then press Go. The selected criteria are then highlighted and colour coded. Each criterion's colour is then maintained within SOURCERY's various plots.
2. Defining Preferences via Pairwise Comparisons
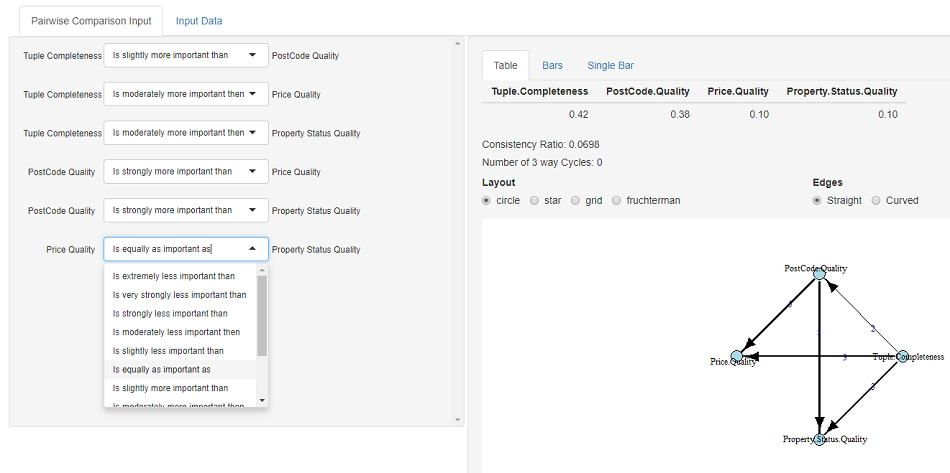
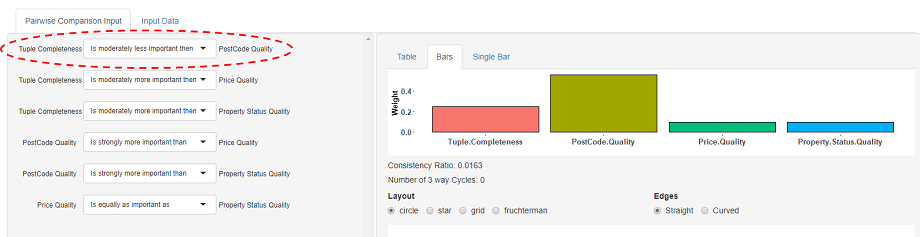
Next, the user can define his/her preferences between the set of criteria via a set of pairwise comparisons. Each comparison consists of a pair of criteria, and the user's strength of preference between the pair is selected via the list of verbal options in the drop-down between the two criteria. Each comparison is initially denoted as equal importance and the user can change as many as they wish. After each comparison update the set of criteria weights are recalculated, these can be viewed on the right either numerically or graphically.
For example, tacking the first comparison, say that to the user Tuple Completeness is a little bit more important to him/her than PostCode quality then they can denote this as  Continuing specifying pairwise comparisons as in the image below should result in the calculation of a set of criteria weights of w = {0.42,0.38,0.10,10}. From this we can see that Tuple completeness is the most important criterion, followed closely by Postcode quality. A visualisation representation of the set of comparisons as a Directed Acyclic Graph (DAG) is shown below the weights. Furthermore, inconsistency analysis of the set of comparisons regarding the Consistency Ratio (a cardinal measure) and the Number of 3 way cycles (a ordinal measure) are shown above the DAG. For discussions and definitions of inconsistency analysis and measures see [6].
With the pairwise preferences elicited pressing RUN, at the top of the results panel, then fires off SOURCERY to find a source selection result most aligned with the set of preferences.
Minsum Optimisation
SOURCERY looks to find a source selection result that is aligned most optimally with the set of elicited preferences using the MinSum algorithm (For the full definition and experimentation analysis of MinSum see [5]). In this way, SOURCERY harnesses the kind of optimisation that can be applied within supply chain management domains such as supplier selection modelling [7].
- Minsum utilises the user’s preferences within optimisation to determine the most suitable sources to select.
- In this way it looks to find a best effort solution, given the available data sources.
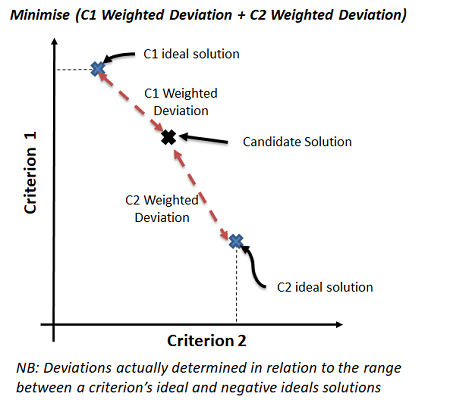
- First, the best and worst possible solutions for each criterion are determined (via a set of single objective optimisations)
- Then, this information is used along with the user’s preferences to find a trade-off solution that minimises the overall weighted deviation - the set of weighted deviations from what is possible for each criterion
- Therefore, when a criterion is given a higher weight, deviation from its ideal solution gets more emphasised, and thus the optimal solution will be closer to its ideal solution
- Through the calculation of each criterion's possible value ranges Minsum is able to ascertain when a criterion value is good/bad in terms of what is possible and consider this when assessing the merits of candidate solutions
3. Analysing Source Selection Result
3.1 Selected Sources
With a source selection solution found the user can explore the result via a visual overview of sources selected and their properties. Each criterion value for each selected source, normalized with respect to the range of each criterion within the set of available sources, is shown along with each source’s overall criteria values sum - by which selected sources are ranked. The selected source values can be further analysed by toggling if they are shown weight-adjusted, with respect to the criteria weights, and the selected sources can be ranked by their overall weighted criteria values sum.
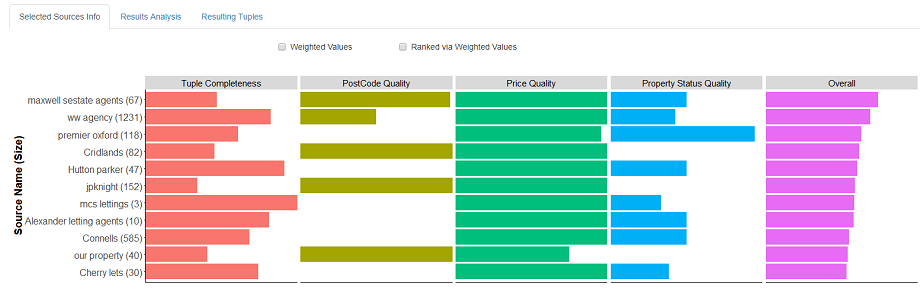
3.2 Contextualising Results
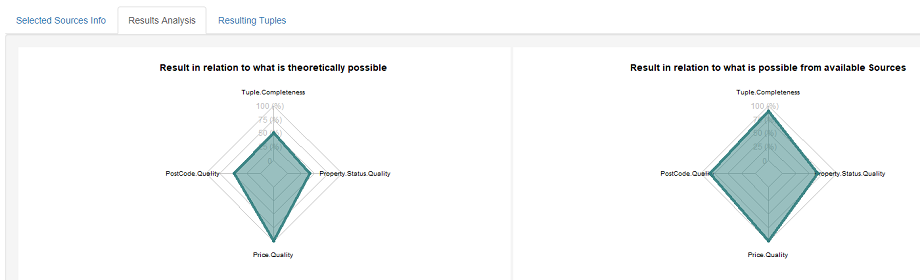
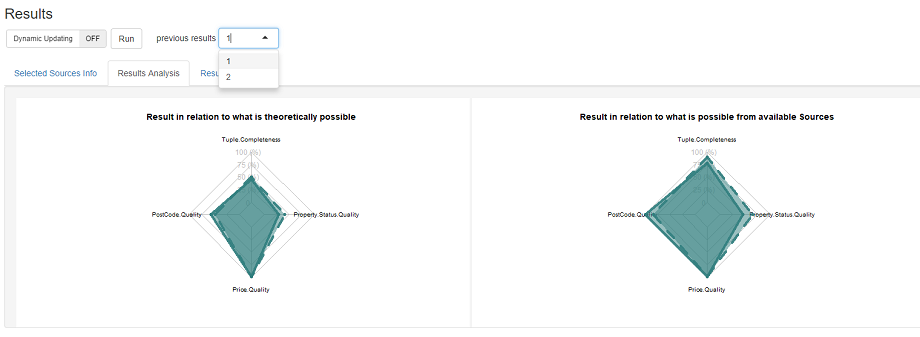
For the sources selected in our solution we see that despite postcode quality being important to the user the selected sources have mixed levels of postcode quality with multiple selected sources having none. To help explore a solution further contextualization analysis facilitates analysis to explore, for each criterion, how the result compares in terms of both what is theoretically possible and what is possible given the set of available sources.
For example, in our solution we observe that in relation to what is theoretically possible for the postcode quality criterion our solution is about 50%. However, in terms of what is possible from the available sources our solution is over 75%. Such analysis of a result aids a user to get a deeper understanding of a source selection result as well as the selected dataset of sources.
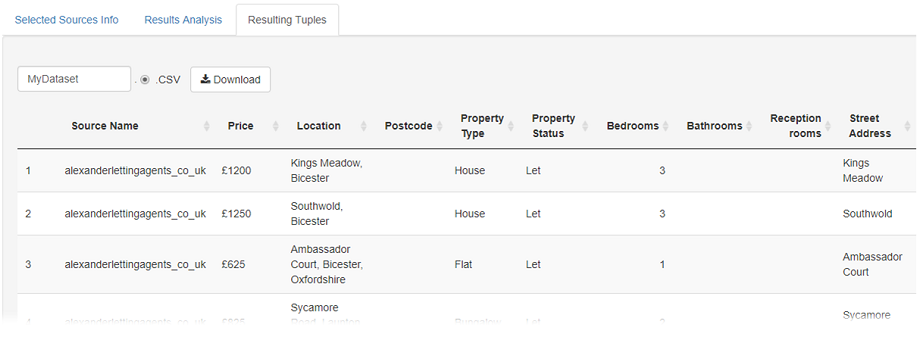
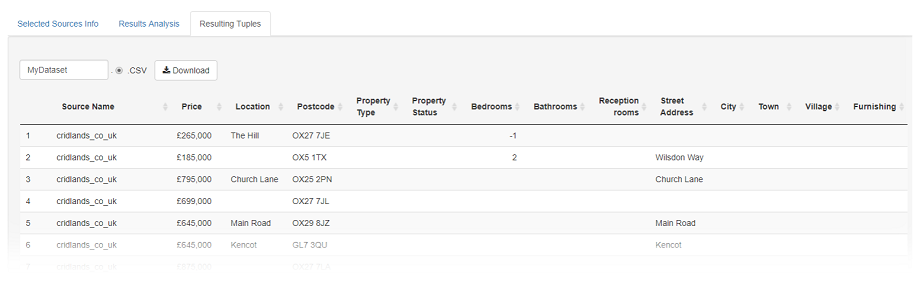
3.3 Retrieving Tuples
If the user is happy with the source selection result, then it can be realized and the resulting selected tuple-set presented to the user. For our example solution we observe, as expected from the contextualisation analysis, that postcode quality of the result is quite patchy. If for the user's needs the postcode quality is not good enough then they can go back and fine tune his/her preferences. (Here we have realised the source selection solution to see the tuples however, from the previous analysis we were able to determine the result properties therefore, solution fine tuning can be done before realising a result. This may be preferable if realising the result has high costs associated regarding time/costs.)
4. Fine tuning and Comparing Results
SOURCERY allows a user to fine tune the source selection result by exploring how changes to his/her preferences impact the result. A new found solution can then be analysed and compared to previous solutions. For example, from our initial solution result, if after analysis of the result the user determines that postcode quality should be more important, they may go back to the the set of pairwise comparisons and change the first comparison to now denote that Tuple Completeness is moderately less important then Postcode quality. The updated weights from this update are shown below, from this we observe that postcode quality is now the most important criteria by quite some distance. The optimisation can then be re-run with the updated preferences.
We can then explore the contextualisation analysis of the update source selection result. Moreover, the initial solution can be compared alongside this new solution - by selecting 1 from the previous results dropdown. The previous result in shown in the spider plots as dashed lines. From this we observe how in the updated solution the postcode quality has improved, and is now 100% in relation to what is possible within the available sources. However, we further observe that this increase has come at the expense of some Tuple Completeness quality and Property Status quality. Such analysis of the trade-offs involved aid validation and traceability of a source selection result and help a user to ascertain what is possible and thus realistic.
Realising the tuples from the selected sources of the updated solution (Ensure no previous result is still selected in the dropdown!) the improvement in the postcode quality can be observed.
NB: Although from the contextualisation analysis we see that the updated result is now as good as it could be given the possible available sources its still only a fair result in terms of what is theoretically possible regarding postcode quality. Here SOURCERY has found the best effort solution given the parameters of the problem such as the quality of the available sources but also that minimum result size parameter. To further look to improve the postcode quality of a result futher fine tuning could be performed to reduce the minimum result size parameter.
Conclusions
The SOURCERY system supports interactive multi-criteria user driven source selection to find data aligned with the intended use of the data by the user. The system utilises Pairwise Comparisons to aid eliciting a user’s preferences between a set of criteria then looks to find a source selection result aligned to the user's preferences. Analysis over the results provide an interactive, exploratory and well informed source selection activity.
Any comments, questions, suggestions or bugs! regarding SOURCERY get in touch with Ed Abel.
SOURCERY is part of the VADA Project, which is supported by a Programme Grant of the UK Engineering and Physical Sciences Research Council (grant number EP/M025268/1. For further information of the VADA project and its architecture see [8].